• You are viewing the forum as a Guest, please login (you can use your Facebook, Twitter, Google or Microsoft account to login) or register using this link: Log in or Sign Up

Gas-exchange experiments

hax47

Member
Joined
29 Jun 2023
Messages
133
Location
Hungary
Last week, I ran an experiment to see what the CO2 concentration will be in water left to equilibrate on air and how quickly we can reach the equilibrium with or without agitation. The experiment was a bit sloppy, so I plan to repeat it, but this time with a little more careful planning of the conditions and splitting different questions into different experiments. Also, I have a few ideas and questions that can be tested with a single pH meter so I will collect those experiments here. Any contribution, critics, ideas, or measurement repeats are welcome. I am unsure if answering the questions below would result in practical benefits, but a better understanding of the aquarium systems can not hurt. Anyway, I am curious if anything comes out of these. So, here are the initial ideas/questions that I think could be tested, not all related to each other:

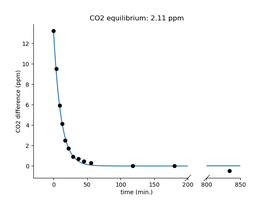
1. Equilibrium CO2 concentration in the water left in the air. I already tested this, but I don't know if I have waited enough, and also, I did not calculate with the evaporated volume. We could also simply calculate it using Henry's law, especially if we know the CO2 levels in our room, but still, I think it is worth seeing it for ourselves. The equilibrium level is also required for some of the further experiments.
2. Testing the dynamics of the CO2 exchange. How quickly does the equilibrium happen? How will the water's volume, surface area, and agitation influence this? This is the second question I tried to approximate last time, but I would separate this question from the equilibrium measurement. I'd like to test whether we can use Fick's law to calculate/predict the CO2 exchange rate between water and air. If so, can we come up with a simple test to describe the gas exchange rate (actually the diffusion capacity) in any specific aquarium?
3. Can we estimate the CO2 production in a specific tank using pH and KH measurements only? If we know the diffusion capacity of an aquarium, and the actual CO2 levels in it (and in the air), then this should be doable.
4. Can we estimate the average O2 levels in an aquarium based on the CO2 production and the gas exchange rate in an aquarium?
5. Can we estimate the level of non-bicarbonate buffers in our tank? Non-bicarbonate buffers (phosphate and organic compounds) will modify the readings of our KH tests and result in false CO2 calculations.
6. Does the CO2 have better solubility/higher levels in water with low KH than in one with high KH? I don't think so, but this idea has been circulating for a while, and it is easy to test. If the equilibrium CO2 levels are not different, is the diffusion rate of CO2 different? There is probably already data for that somewhere, but still, I would like to test that too.

The idea of some of these tests comes from identical testing in human medicine. In human blood, similarly to aquariums and natural aquatic systems, the main buffer is the bicarbonate, along with some phosphate and organic molecules (proteins). The pH is regulated through lung ventilation (affecting the CO2 levels in the blood). The modern human respiratory acid-base physiology was born in 1950s during the poliomyelitis pandemic with the need to determine the CO2 levels in the blood to estimate the ventilation need of the patients. It turned out that one can do that by measuring pH only... Based on pH measurements, CO2 levels, bicarbonate concentration, and the concentration of other non-bicarbonate buffer levels can be determined using the basic principles and equations of the CO2/pH/bicarbonate connection. The diffusion capacity is also determined nowadays for patients with lung diseases to estimate the capacity of the lungs to exchange CO2 for O2. In aquariums, it could describe how well the aquarium is aerated with a number that could be comparable between aquariums. We need some methodological modifications for aquarium water testing at home, but maybe we can come up with a strategy to get estimations for the above questions.

Equilibrium CO2 levels in water.
The first experiment would be a reproduction from the last week, with some modifications:
1. The aim is to measure the equilibrium CO2 levels; no dynamic changes
2. To avoid water heating, the water will be aerated with an air pump instead of a small pump. I will use a calculator which considers the temperature.
3. Two water samples will be used, both aerated and having 10 dKH hardness set with NaCO3. In one of them I will use water as it comes out of the RO device, while the other will be boiled for an hour to degas it. Hopefully, one will reach the equilibrium CO2 concentration from above, the other from below. The pH in the two jars should be equal at the equilibrium concentrations.
4. I plan to measure the jars with water before the start and the end to get the amount of evaporated water. Then, the bicarbonate concentration can be corrected.
Any recommendations?
 
These are excellent questions and I will follow your investigations with high interest. I'm working through some of the physical chemistry parameters for my own specific low-tech aquarium set-up and depending on how theoretical you want to get I have found the Comprehensive Study of the Hydration and Dehydration Reactions of Carbon Dioxide in Aqueous Solution to be invaluable. The equilibrium pieces are interesting, but so are the underlying kinetic rate equations for when you're not in an always-at-equilibrium environment.
 
Thanks, Andy; I'll check it, it looks interesting!

To give a little background for the plans, I'll try to explain the ideas and the theory behind it. I hope that if someone sees a mistake will help and correct me. It will be simplified a bit but might still seem a bit complicated. In the end, the useful part is quite simple, I think.

So Fick's first law of diffusion:
It describes the flux of molecules (also gases) and can be applied both within a solution and between air and solution (water). If someone reads the Wikipedia site, it can be overwhelming, but there are a few simplified forms/derivatives:

J = D * A * (Δp / Δx)

where
J is the amount of gas transferred per unit of time
D is the diffusion coefficient specific to the gas in question; it is different for CO2 and O2
A is the surface area for gas exchange
Δp is the partial pressure difference of gas between two compartments
Δx is the distance in which the molecule diffuses

So the bigger the surface, the shorter the distance, the bigger the partial pressure difference (diffusion driving force) and the diffusion coefficient, and more molecules will diffuse per unit time.

It is not easy to calculate with the surface in the case of a complex system like an aquarium, especially if it is not a still surface, and the distance is also ambiguous. But we can merge Δx, A, and D into a single coefficient DC, the diffusion capacity or conductance of the aquarium. You can find this form (with concentration instead of partial pressure) of the law on Wikipedia under the "Biological perspective" part:

J = -DC * (p2 - p1)

The point is that we can calculate the partial pressures of CO2 (p1) in the aquarium from the concentration values. We can also get or approximate the equilibrium concentration (air CO2 partial pressure, p2). If we increase the concentration (with CO2 injection for some time and then switch it off, or simply we do a water change) and watch it decrease in time, we should be able to calculate the J (CO2 concentration difference between time points 1 and 2, multiplied by the water volume). Once we have those, we can calculate DC, the value characteristic of our system, describing how well the aquarium is aerated. Maybe we will need some derivation skills here, I am not sure. If we normalize that to water volume (or calculate J as concentration flux and not as gas amount flux), it would be comparable across different aquariums.

If we know the diffusion coefficients for CO2 and O2 or the ratio of these two values, we can also calculate the DC for O2 (DC[CO2] * ratio, since all other parameters are the same). There are diffusion coefficients for both gases in water.

So basically, we would measure two pH values at two different time points after the water change, and we could get this DC value as the CO2 levels change.

The CO2 production could also be calculated with this, given there is no CO2 consumption (in the dark). With stable CO2 levels (stable pH) in water, CO2 production equals the CO2 released into the air. Therefore CO2 production per unit of time equals the DC multiplied by p[water] - p[air].
 
Maybe we will need some derivation skills here
1689889650430.jpeg

I will need to study up on the details though. Thanks @hax47 for the deep dive on this!

Cheers,
Michael
 
From Fick's law the movement towards equilibrium should be a first order reaction with rate proportional to the concentration difference between the atmosphere and the tank so (hypothetically) you can fit an exponential curve to your data of the form [CO2 difference]=[CO2 difference at start]*exp(-k * elapsed time) where you curve-fit to find k and the half-life of the reaction is ln(2)/k in whatever units you were using to measure time.
 
I will try that. In this case, would k be in some way equivalent/similar to the diffusion capacity?
If this is an exponential decay, I guess we could represent the CO2 difference in time with a logarithmic time-axis to get a straight line, and k would be the slope?
 
I will try that. In this case, would k be in some way equivalent/similar to the diffusion capacity?
If this is an exponential decay, I guess we could represent the CO2 difference in time with a logarithmic time-axis to get a straight line, and k would be the slope?
Other way around. Plot CO2 difference on log scale and time on linear scale to read off k as the slope. The tricky thing is you're probably not measuring CO2, rather you're measuring pH. You'll need to make some assumptions around how pH relates to CO2. k is 'DC' from your J = -DC * (p2 - p1).
 
Other way around. Plot CO2 difference on log scale and time on linear scale to read off k as the slope. The tricky thing is you're probably not measuring CO2, rather you're measuring pH. You'll need to make some assumptions around how pH relates to CO2. k is 'DC' from your J = -DC * (p2 - p1).
Thanks, I'll do that. Well, the assumption between pH and CO2 here is the Henderson–Hasselbalch equation, based on which the pH/CO2/KH triangle is usually calculated.
I know that KH does not show only the bicarbonate concentration but rather alkalinity, but that problem we can manage, I think. Anyways, I want to start with clean bicarbonate solutions, where KH is set, and try the calculations with that and later apply it to aquariums.

I'll run the equilibrium experiment until tomorrow and then start measuring the kinetics. The one with boiled water started with a pH of 9.11 which at 23°C, with 10 dKH, gives a 0.13 or 0.25 ppm CO2, depending on which method I choose. Does someone know the difference between Tucker (1984) and Millero (2002) methods on this site? I suspect that different pKa and solubility values are used...

Now back to the alkalinity/KH vs. bicarbonate concentration question and how the bicarbonate concentration could be calculated using pH measurements...

The pH dependence on the CO2 and bicarbonate concentration in a bicarbonate buffer is described by the Henderson-Hasselbach equation:

pH = pKa + log([HCO3-]/[CO2])

where

pKa is the -log of the acid dissociation constant for the CO2 + H2O <--> H+ + HCO3- reaction.

[HCO3-] and [CO2] are the molar concentrations of bicarbonate and CO2 in solution

The same equation rearranged:

pH = pKa + log([HCO3-]) - log[CO2])

In a clean bicarbonate buffer (no other buffers present), changing either the [CO2] or [HCO3-] should not result in significant changes in the other concentration, at least not above the pH value of 6 and when some KH is available. So if we check the correlation between pH and log[CO2], we can say that [HCO3-] is a constant when we change the CO2, and pKa is also a constant; we can combine them into a single constant to get a linear equation:

pH = -log[CO2] + const

So, a negative linear correlation exists between the pH and log[CO2], and the slope is -1. Because the bicarbonate concentration determines the const, the y-intercept/horizontal position of the line tells us the bicarbonate concentration:

pH log[CO2].png


In case there are more buffers, not just bicarbonate, changes in CO2 also change the HCO3- concentration. More CO2 leads to more bicarbonate and vice-versa. Now the slope of the correlation between pH and log[CO2] will no longer be -1, but steeper, the more other buffers, the steeper will be the line:

pH log[CO2] not iso.png


Determining the blood acid-base parameters (CO2 partial pressure, concentration of the bicarbonate and non-bicarbonate buffers) in medicine relies on these principles. A blood sample is taken, pH is measured, then the sample is equilibrated with two different CO2 pressures. pH is determined again at those conditions, and the buffer line can be constructed. Now the position, slope, and actual pH give us all the parameters. in the past, the so-called Siggaard-Andersen nomogram was used to get these; nowadays, it is all automated.

The point is, that with only pH measurement, many parameters can be determined. Equilibrating aquarium water with known CO2 pressures is unrealistic in a home setup, but manipulating the bicarbonate concentration is easy. Similarly to the above, we can rearrange the equation to get the correlation between [HCO3-] and pH. Given pH is above 6, and some KH, we can say that CO2 concentration will not change when HCO3- is increased and can be taken as constant:

ph = log([HCO3-]) + const

So, there is a positive linear correlation between pH and log([HCO3-]), or log KH:
pHlogbic.png


Suppose we take a water sample and determine the KH and pH values; we will have the first point on the plot. Then we add some more KH with HCO3- solution and determine the pH again. If the slope is 1 (e.g., doubling the KH results in ~0.3 increase in pH), then the majority of the buffer in the aquarium water is bicarbonate, and the KH test shows real "KH"/bicarbonate. Now we can use the KH reading to determine the CO2 levels:
Aq nomogram.png

If the slope is not 1, we need something to calculate the real KH from the alkalinity. I have not thought that through yet, but I think that that should be possible.
 
Does someone know the difference between Tucker (1984) and Millero (2002) methods on this site?
Millero claims to make measurements in seawater which is not going to be the same as fresh (although might not be much different). I couldn't dig up the original Tucker reference. The method I'm currently using is based on the "hydroxide path" where CO2 + OH- <--> HCO3-. The equilibrium constant for this reaction in water is 3.02e+7 so...

[CO2] = [HCO3-]/power(10,pH-14)/3.02e+7

Your 10 dKH represents [HCO3-] of 3.56e-3 depending on which equilibrium constants and method you use. With your pH of 9.11 that gives [CO2] = 9.15e-6M which is 0.4 ppm.
 
I will use the Tucker method, for now, to keep it simple. The parameters in the bicarbonate buffer equations seem to be dependent on the ion concentrations, so that could make a difference between this and the Millero method.
Your calculated [HCO3-] concentration made me realize that I can not simply replace log([HCO3-]) with log(KH) in the above plots...

Today I played a bit with the experiments. I have run the equilibrium experiments for 3 days and today determined the pH. This was the setup:
Two jars, both with RO water set to 10 dKH with NaHCO3. One started with water as it came out of the RO device (pH 7.35 after KH adjustment), and the other was boiled for 30 minutes (pH 9.11). This latter was cooled down before the addition of the NaHCO3-. The KH was adjusted with a stock solution of 500 ml RO water + 15 g NaCO3, corresponding to 1000 dKH. I put 5 ml into 495 ml water for a 10 dKH final value. Interestingly, when I checked the hardness this time, I was closer than last time (measured 13 last time, now 11). I made the stock more concentrated this time to avoid adding too much CO2 with the stock solution to the boiled water. Both were aerated with air stones.

Both jars ended up with a pH of 8.5, so this might be the equilibrium pH with our room's CO2 level. 70 ml of water evaporated from both jars. So the end alkalinity is 11.6 dKH, which gives 1.16 ppm CO2 with the calculator (Tucker option). Either CO2 is higher in our room, or I can not get a better accuracy with my equipment.

I also ran some kinetics measurements today. I had two jars with out-of-the-device water (higher CO2) and aerated them with air stones. Here is the pH difference decrease in time (pH at equilibrium, 8.5 minus the actual pH). Andy suggested this plotting as it should give the same slope as the log(CO2 difference):
pH_diff.png

I guess this should be a straight line... ?
This is how the calculated CO2 difference values (actual CO2 minus the equilibrium value - 1.1 ppm) look like; the line shows the fitted curve with the suggested equation (this is jar 2, the other looks very similar to this):
CO2.png

I struggled a lot with the pH readings, I had to recalibrate the pH meter a few times, and it took me forever (~2 minutes) to get stable readings. I ordered a new electrode for it and will replace it before I do any other measurements. I think it is just not accurate enough anymore for the task.
 
I think both Tucker and Millero differ from your calculation in their dissociation constants. I tried to apply the constants from the paper you linked in this equation:

pH = pKa + log([HCO3-]/[CO2])

Which applies to the CO2 + H2O <---> H+ + HCO3- equation. They do not determine the K for this reaction (they refer to it as K3), but based on their table, one can calculate it as K3 =K1 /Ka2 . -log(K3) or pK3 based on that is 6.52 at 25 °C, which, when applied in the above equation, gives the same results as the one you use.

Edit: the K3=K1/Ka2 equation is wrong, correctly: K3 = K1 x Ka2. The pK3 of 6.52 is good though. Thanks to Andy for bringing it to my attention.

I also calculated the pKs for other temperatures; at 34 °C and 40 °C, they are 6.31 and 6.38. This is above the 6.1, which is used for blood samples, but since it depends on the ion concentration, it might be more realistic in fresh water. Blood ion concentrations are much higher than in freshwater. I can't find a better source for pKa-s in fresh water. In the Millero paper, they get a value of 5.88, but seawater has about 3x-4x as much sodium per liter of water as blood. So, 6.52 in 25°C fresh water might be just good. Also, I took 10.3 as the pKa for the HCO3- <----> H+ + CO3-- reaction. This is probably not true, but I have not found a better one yet.

So with those values, if I take the pH of 8.5 as the equilibrium in my room (1.6 ppm CO2), I get this:
CO2.png

If I increase the equilibrium level to 3.5, I get a better fit, but I doubt that that would be the right value:
CO2_3.5.png

I think I need a much more accurate pH measurement, especially at lower CO2 levels. I'll get the new electrode tomorrow, so we will see if that helps.
 
Last edited:
It seems to me like you need a more reliable way to measure KH, since many of the steps you described involve this measurement, and your test doesn't want to agree with your bicarbonate scale.
 
Last edited:
It seems to me like you need a more reliable way to measure KH, since many of the steps you described involve this measurement, and your test doesn't want to agree with your bicarbonate balance.
Hanna Instruments sells a couple of kits that are pricey, but good. I use their more chemistry-orientated acid titration with pH indicator which for me has been reasonably precise and near as I can tell also accurate - it agrees with what the local water company report says for my tapwater alkalinity. They also have a more straightforward to use "read the number right off the device" colourimeter which comes in both freshwater and seawater versions, for about the same price.
 
It seems to me like you need a more reliable way to measure KH, since many of the steps you described involve this measurement, and your test doesn't want to agree with your bicarbonate scale.
I use the cheapest KH test available, so the lack of accuracy is not a surprise. At lower KH, the accuracy might be a bigger problem, at 10 dKH one drop plus or minus does not change the calculations much. I'll need to calibrate every batch of the test.
I use their more chemistry-orientated acid titration with pH indicator which for me has been reasonably precise and near as I can tell also accurate - it agrees with what the local water company report says for my tapwater alkalinity.
This seems to be easy to do, a good indicator that changes color at low pH, plus an acid solution with the right HCl concentration should do the trick. One can go as precise as needed.
 
It seems to me like you need a more reliable way to measure KH, since many of the steps you described involve this measurement, and your test doesn't want to agree with your bicarbonate scale.
I was thinking a bit, and I think I can make my KH test more accurate and reliable. The KH test working principle is quite simple. There is an indicator in it that changes color at a pH of around 3, and we need to add acid (titrate) until we reach that point. From the amount of used acid, we get the KH.
This is the test I am using; it costs 2-2.5 euros:
KHtest.jpg

The vial needs to be filled up to the line with aquarium water, and then drops are added until the water turns yellow from blue.
Now there are a few things that can make this test inaccurate:
1. The solution acid concentration is wrong; there is some error/variation in the production process
2. The water volume needs to be eyeballed to the line, which is not 100% precise.
3. There can be variations in the test solution drop size, especially if the drop comes out with an air bubble.

Still, if there is only a 10-30% error, the accuracy is good enough for aquarium water samples; it usually does not make any difference. At low alkalinity levels, the resolution is already worse than that inaccuracy. For example, if the actual hardness is 2.5 dKH, even with the most precisely produced test, one will get a result of 3 dKH, which is already off by 20%.

That being said, the accuracy can be improved:
1. The water can be measured with a syringe or pipette to make the volume accurate.
2. The test can be calibrated with a standard NaCO3 solution to account for the wrong acid concentrations in the test. For example, if the test measures 12 dKH instead of 10 in the calibration solution, the sample volume can be adjusted (decreased) until it reads exactly 10. So we can correct this inaccuracy by volume adjustment
3. Increasing the water volume can reduce the drop size variation effect. We can double the water sample volume, which will need 2x that many drops to titrate. Or we can take 4x volume and add 4x drops to titrate. In the end, the result needs to be divided by the same multiplier number to get the actual dKH. As an added benefit, the precision of the test increases to 0.5, 0.25 dKH, or 1/x of whatever x the volume increase was.
Edit:
Also, the measuring vial and the syringe must be rinsed well with the water being tested before taking the samples.


If the alkalinity is very high, the sample can also be diluted with RO/distilled water so that the test solution would last longer.
 
Last edited:
I got the new electrode for the pH meter, so here is the previous experiment repeated, but this time in a bucket to allow for a little bit slower equilibrium.

Setup:
10 dKH water, made from RO and KH set with a stock solution of NaCO3 of 15 g / 500 ml ( "1000 dKH" solution)
6 l volume in a bucket aerated with a 480 l/h air pump + airstone
initial CO2 is what happens to be in the tap water after going through the RO device and after setting the hardness
I took a sample of water at different time points with a coffee cup and measured the pH in it
pH meter is calibrated with 7.01 and 10.1 buffers before the start

bucket.gif
pH_meas.jpg


Calculations:
I calculated the CO2 concentrations with the Henderson-Hasselbach equation with the dissociation constants from the paper Andy recommended. The missing constant (pKa for HCO3- <----> CO3-- + H+) I set 10.3.

Then for the kinetics curve fit, I used the recommended equation for first-order reactions. Instead of using the CO2 difference in the equation, I modified it to include both actual CO2 concentrations and the CO2 equilibrium value (with air), so I could fit it for both parameters (k, and CO2_eq):

CO2_actual_diff = CO2_start_diff * exp(k*time)
that is:
CO2_actual - CO2_eq = (CO2_start - CO2_eq) * exp(k*time)

So the equation I fit for the k and CO2_eq values is this:

CO2_actual = (CO2_start - CO2_eq) * exp(k*time) + CO2_eq.

data (sorry for the horizontal layout, but I can't control the table size, and the vertical layout would be just too wide and too long) :
time
0​
4​
9​
13​
17​
22​
29​
37​
45​
56​
118​
180​
834​
pH
7.53​
7.65​
7.81​
7.92​
8.05​
8.13​
8.23​
8.26​
8.3​
8.33​
8.38​
8.38​
8.5​
CO2
15.3​
11.6​
8​
6.2​
4.6​
3.8​
3​
2.8​
2.6​
2.4​
2.1​
2.1​
1.6​
CO2_diff
13.2​
9.5​
5.9​
4.1​
2.5​
1.7​
0.9​
0.7​
0.5​
0.3​
0​
0​
-0.5​

The fitted parameters:
k = 0.09 1/min (diffusion capacity of the setup, meaning that 0.09 ppm CO2 will diffuse out of the water per minute with each ppm difference compared to equilibrium concentration)
CO2_eq = 2.11 ppm

CO2_eq_2.png

Edited: changed the figure because it had the wrong y-axis label

The dots are the calculated CO2 levels, and the line is the fitted curve. It may seem like a good fit, but if you look at it closer, the curve at around 50 minutes and at the last point misses the results. Also, the equilibrium value is higher than the CO2 level at the last point. One thing that comes to my mind and might result in such deviation is that with this calculation, it is hypothesized that CO2 levels in the air above the water column equilibrates with the room CO2 levels instantaneously. This might not be true, and if there is some lag in the equilibration in the air CO2 levels, it will affect the diffusion at low concentrations more since the CO2 diffusion rate in the air should also be dependent on the CO2 difference. I'll repeat the experiment with a fan over the bucket; that should address this problem.

btw, is there a way to include LaTex text in posts? That would help with the equations.
 

Attachments

  • CO2_eq.png
    CO2_eq.png
    20.5 KB · Views: 81
Last edited:
On second thought, the above graph does not look bad. I repeated the experiment, now with a fan over the bucket:
20230726_152724.jpg

The k is a bit higher; not sure if the difference would be significant if I repeated it multiple times, but it makes sense. The last point on the first experiment (without a fan) is cut now to be comparable to the second experiment:
CO2_both.png

On the equilibrium CO2: 2 ppm is above the expected value, although it is probably slightly overestimated; in a longer experiment run, it could be slightly less. It depends much on the exact pKa used for the pH --> CO2 concentration conversion. If I use smaller values, as in many only calculators (including the one on this site), the equilibrium value also gets less (around 1.2 ppm). I will probably run an experiment in the backyard as well, that could be a calibration experiment.

So, we have a bucket diffusion capacity value now, I guess I can start experimenting with the buffer lines to estimate the bicarbonate concentration from KH readings.
 
Back
Top