• You are viewing the forum as a Guest, please login (you can use your Facebook, Twitter, Google or Microsoft account to login) or register using this link: Log in or Sign Up

Gas-exchange experiments

I don't make any claims as to CO2 concentrations, but I did a water change in the low-tech Shrimphaus this weekend and tracked the pH with respect to time following the water change. The tap water I use has a lower pH than water equilibrated with the atmosphere, presumably from extra dissolved CO2 held in solution by the elevated water pressure in the lines. An exponential curve fit the observed changing pH* in the tank very well with a half-life of pH equilibration of around 1h15m in this system. The curve fit suggested an equilibrium pH of around 9.13. The measured alkalinity came out to 216 ppm CaCO3 half-way through the experiment and the pH eventually equilibrated at 9.17 rather than 9.13, but to be fair, this aquarium is a dynamic system with growing plants and a small shrimp colony so some deviation from theorical values is maybe not a huge surprise.
* since pH is log transformed, I curve fit to the linear [H3O+] rather than pH, where [H3O+] = 10^-pH
 

Attachments

  • 230723 Shrimphaus wc curve fit.png
    230723 Shrimphaus wc curve fit.png
    103.9 KB · Views: 72
Last edited:
I curve fit to the linear [H3O+] rather than pH, where [H3O+] = 10^-pH

Great results! Great idea for plotting the [H3O+] concentration! I never thought about that, but basically, [CO2] is linearly correlated to [H+] (or [H3O+], more precisely), so whatever the kinetics of the [H+], the same is true for [CO2].
This correlation can be seen from the Acid dissociation constant:
7cdd9efda0e3a32060020b5c9e5b2c78981b2a93

In our case, the [HA] is the CO2, and [A-] is the bicarbonate, so

[H+] = Ka * [CO2] / [bicarbonate]

or,

[CO2] = [H+] * K,

where the K constant depends on the bicarbonate levels, whatever they are, and on the uncertain dissociation rates. That means one can determine the aquarium diffusion capacity solely with pH values; there is no need to determine the bicarbonate and/or CO2!
My results plotted this way:
with (left) or without (right) the fan, [H+] on the y-axis, and time in minutes on the x-axis:

CO2_fan.png
CO2_no_fan.png


I get the same k values as with the CO2 calculations, as expected. The equilibrium pH is below the expected ~8.5 for me, too; I am not sure why. The diffusion capacities in my aerated bucket are expressed as 1/min; if we convert it to 1/hour, we get 0.1 * 60 = 6/hour, which is about 10x higher than in the Shrimphaus (0.59/hour). Interesting, I can't wait to have the water changes myself to see them in my aquariums.
 
I was going to suggest that so you can avoid the higher, and more variable, CO2 levels found indoors.
I will do that, if we can take the outdoor CO2 as constant, maybe we can also have the relevant pKa for our aquariums. Hopefully, the water will not warm up too much in a few hours.
 
The diffusion capacities in my aerated bucket are expressed as 1/min; if we convert it to 1/hour, we get 0.1 * 60 = 6/hour, which is about 10x higher than in the Shrimphaus (0.59/hour). Interesting, I can't wait to have the water changes myself to see them in my aquariums.
Can you change the rate of aeration in your bucket? That will likely influence the timing. If you can't change the output of the air pump directly you could try different attached airstones which will modulate the air flow.
 
Can you change the rate of aeration in your bucket? That will likely influence the timing. If you can't change the output of the air pump directly you could try different attached airstones which will modulate the air flow.
I can change the rate with the control knob, I will try to do that. This will be similar to the very first experiment with two jars, one with aeration and one without, but with less extreme differences. I was also thinking that a lid could make a difference too.
 
I was also thinking that a lid could make a difference too.
Or not, I guess the CO2 amount in water is almost negligible to that in the air. Might be dependent on the water volume/air volume ratio.
 
the accuracy can be improved:
1. The water can be measured with a syringe or pipette to make the volume accurate.
2. The test can be calibrated with a standard NaCO3 solution to account for the wrong acid concentrations in the test. For example, if the test measures 12 dKH instead of 10 in the calibration solution, the sample volume can be adjusted (decreased) until it reads exactly 10. So we can correct this inaccuracy by volume adjustment
3. Increasing the water volume can reduce the drop size variation effect. We can double the water sample volume, which will need 2x that many drops to titrate. Or we can take 4x volume and add 4x drops to titrate. In the end, the result needs to be divided by the same multiplier number to get the actual dKH. As an added benefit, the precision of the test increases to 0.5, 0.25 dKH, or 1/x of whatever x the volume increase was.
There is one more important thing I just realized when retesting my 10 dKH water samples; Both the measuring vial and the syringe has to be rinsed well with the water being tested before taking the samples.
btw, I tested my 900l aquarium water with two batches of the same tests; one gave 13 dKH alkalinity, the other one 16. I'll need to calibrate and adjust every single batch.
 
Yesterday I repeated the bucket experiment (6 liters of 10 dKH water, starting CO2 from the tap water, aerated, and the temperature was 23±1 throughout the experiment), this time outside on the porch, where the CO2 concentration in the air should match the atmospheric levels, which is about 421 ppm or 0.04%.
The solubility of CO2 in water at 25 °C, according to this source is: 1.449 g/l
CO2 fraction in the air: 0.0004 (corresponds to 0.04%)
solubility * CO2_fraction * atmospheric_pressure = 1.449 g/l * 0.0004 * 1 = 0.0005796 g/l = 0.5796 mg/l (or ppm)

With that in mind, here are the data; the CO2 concentration is calculated with the pKa value (6.52) from the paper Andy recommended:

time (min)
0​
5​
8​
12​
17.5​
23​
31​
45​
60​
79​
102​
193​
269​
323​
384​
835​
pH
7.63​
7.86​
7.95​
8.04​
8.21​
8.3​
8.4​
8.57​
8.66​
8.72​
8.8​
8.89​
8.91​
8.93​
8.9​
8.89​
CO2
12.18​
7.16​
5.81​
4.72​
3.18​
2.58​
2.05​
1.38​
1.11​
0.97​
0.8​
0.65​
0.62​
0.59​
0.63​
0.65​

At the lowest, it reaches 0.59 ppm CO2 concentration, which is very close to the theoretical equilibrium value; I don't think I could get better measurements with my equipment. After this time, the calculated CO2 went higher; I am unsure if this is just measurement variability or if CO2 was actually higher here. It was already dark outside at 384 min., so it could be that the backyard CO2 also fluctuates a little bit with lighting. We have lots of trees around. I would need to repeat the measurement to conclude that this small increase after sunset is a significant change.

Anyways, I think there are a few conclusions from this and the previous experiments:
1. the backyard equilibrium CO2 levels in the water match the expected values
2. the pKa of 6.52, calculated from the paper, seems to be a good value to be used with this water salinity and temperature
3. CO2 levels inside the house can be significantly higher than the outside CO2 levels. This may affect the aquarium's CO2 levels, especially in low-tech. There might be variability here depending on the house parameters/resident numbers, time of the day, ventilation, etc.
4. The CO2 levels in water with known bicarbonate concentration can be estimated quite accurately. This is nothing new, but now there is a constant that seems to apply to these water parameters.

I fitted the equation we used before; it looks like this (more about it in the next post):

outside_CO2_all_data.jpg


I changed the fitting process a little bit. Instead of fitting to minimize the raw residuals (actual_data - calculated_data), I now minimize the normalized residuals ( (actual_data - calculated_data)/actual_data) ) to avoid the larger values having a bigger effect on the curve parameters.
 
The curves I fit on the data seem quite good, although they are not perfect. The k parameter should describe the ability of the tank to exchange gases, the higher the value, the faster the gas exchange should be. It should correspond to the diffusion capacity constant in this equation:

J = k * Δp

where J is the amount or concentration of the gas,
k is the diffusion capacity,
Δp is the driving force, partial pressure difference, or CO2 concentration in water minus the CO2 equilibrium concentration.

k should depend only on the aquarium properties, that is, how well the water surface is agitated, how big the surface is, etc ... This should be the same, no matter how big or small the Δp is.

If I take my three bucket experiments and recalculate this value multiple times so that I always leave out x number of measurements from the start (as if I started the experiment with lower CO2 levels), this is what I get:

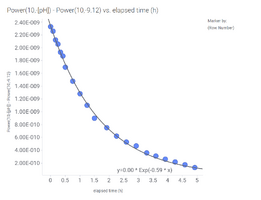
In the first experiment, the bucket is inside the house, with no fan over the bucket:
inside_no_fan_CO2.jpg
inside_no_fan_k.jpg


We get a seemingly good curve fit on the left side, but there are a few dots above the curve. On the right side, the k is shown as a function of the CO2 gradient (CO2 in water - CO2 equilibrium) at the start of the curves at each iteration. The k is shown in relative values compared to the first value. That means we will get slightly different values depending on the time and CO2 levels at which we start calculating the k values. So different k applies to different concentrations, although it should be constant.

My assumption for this anomaly is the following:
model.png

On the left side is the assumption for our exponential equation; that is, the partial pressure in the air is even and constant, so the pressure difference is a linear function of the water CO2 level. On the right side, we have higher CO2 levels in the air near the water surface because CO2 diffuses out of the water. The above-water CO2 level depends on the water level, the CO2 diffusion in the air, and the air movement above the water. This CO2 level difference compared to the left side drawing could be negligible, though, since the CO2 amount in the water is negligible compared to the air, and there could be a fast diffusion in the air anyways. But if not, that should affect the dynamics, and we should not get a perfect curve fit and stable k values.

So I did the experiment with the fan to refresh the air above the water continuously and to keep the air CO2 levels stable, in the hope that I get a better curve fit:

The bucket inside the house, with a fan over the bucket
inside_fan_CO2.jpg
inside_fan_k.jpg

On the left, the curve fit looks only a little bit better than previously. But, if we look at the k-value stability on the right side, they seem stable down to CO2 differences of about 2 ppm. Most likely, the pH measurement accuracy is not good enough at these pH differences to measure these small differences (check the variability of dots 6. - 8. on the left plot around the line, these are near the start of the curve used for k determination for the last two points on the right plot).

Finally, the same plot for the on-the-porch experiment:

outside_no_fan_CO2.jpg
outside_no_fan_k.jpg

Now we have the same points-over-the-curve pattern on the left side as in the first plot above. The k values sink as the CO2 level gets smaller, and the correlation is even steeper than the first time. I guess the lower air CO2 is affected relatively more by the CO2 diffused out of the water as the higher air CO2 levels.

I plan two more experiments to clarify this k anomaly. I'll repeat the porch experiment with two modifications:
1. with a fan: it should rectify the k value across different CO2 levels
2. with a lid over the bucket; this should make the k plot steeper. I might need to place the lid close to the water level to increase the effect.
 
I expect a lot of the gas exchange happens between the water and the bubbles from the aeration, and less so from the surface area at the top where the water meets atmosphere.
That could be, it makes sense that the bubbles can be filled up with CO2, and the air volume in them is more restricted regarding CO2 dissipation than the air above the water. That could cause such a change to k values. I always thought the water movement and constant surface change induced by the air bubbles were the keys to gas exchange. It could be both, and it would be interesting to do an experiment to explore both possibilities.
 
1. with a fan: it should rectify the k value across different CO2 levels
Well, that did not work out as I expected, the fan increased the k values, but the slope is quite the same. It might be the bubbles.

outside_fan_CO2.jpg
outside_fan_D.jpg


I plotted the absolute k values so that the two setups could be compared better.
 
I did water changes on Sunday and measured the pH changes in all four of my tanks. The results are quite interesting:

900l.jpg
160l.jpg
120l.jpg
120h.jpg


On these figures, I took 13 as the carbonate hardness of the water and took it as other buffers did not influence it. This might or not be so, but that could slightly affect the exact CO2 levels. Anyways, it is not the exact CO2 levels here that are interesting.
I see the same thing in every aquarium, but the one showing the best pattern is the 160 l tank (actually 180 after recalculating it). I can actually fit two curves on the data, one before the lights went on and one after:

160l_1.jpg
160l_2.jpg


Now there are a few interesting things about this. The most interesting thing for me is that it starts to converge to a CO2 value of 10 at first, which is well above my in-home equilibrium values. I have lids on all my tanks, and I think what happens here is that the CO2 equilibrates with the headspace air in the tank, and the diffusion out of this space could be quite restricted. The lid openings during the measurements probably contributed significantly to the CO2 dissipation, so I don't think analyzing the exact k values here makes too much sense. I should do the measurements without disturbing the system too much to get those values.

Nevertheless, this was a big aha moment for me. It made me realize that I had the wrong model in my head. I always thought about the aquarium when considering the gas exchange as a water-volume-only system. In reality, if I have lids, my system is a water + headspace air system. And that changes the game quite a bit. First, the gas exchange, the CO2 dissipation from the system happens not between the water and the room air, but between the headspace and the room air (so I could have as much surface agitation as I want, but as long I restrict the airflow in and out of the system, I will not have too much CO2 dissipation). The second thing is that the O2 amount in the system is not only the water O2 content but the water + headspace O2 content. This means that my system has an oxygen reservoir (with ~300 mg/l O2 in equilibrated headspace air instead of ~8 mg/l in water). So if someone limits the gas exchange in a no-lid aquarium, the system O2 levels drop quite steeply parallel with the elevation of the CO2. In a system with headspace, on the other hand, the O2 reservoir could supply the O2 and make the O2 levels relatively stable even during the rise of CO2 levels. I'll have to play with this, both with calculations and experimentally.

The other interesting thing for me was the steep decrease in CO2 after the lights went on. If this starts from a steady CO2 level, the k value here can actually describe the photosynthesis capacity + the light intensity. In a way, it could be used as a relative PAR meter when applied to the same system with the same bioload.

Also, this headspace thing made me start doing some calculations, and I realized that ppm in air is not the same unit as ppm in water. One usually means molecule per one million molecules; the other means mg/l (or mg/kg). The air CO2 content, for example, is 421 ppm, but that could not be mg/l since the weight of one liter of atmospheric air is 1.293 g. CO2 could not be 1/3 of that... Instead, the weight of 1L CO2 gas is 1.836 g (density at 20°C), which, when multiplied by the CO2 volume in 1L atmospheric air (0.0004 L), gives 0.0007344 g/L, or 0.73 mg/l concentration. And the 421 air CO2 ppm is the number of CO2 molecules from one million air molecules. Do I make an error in this calculation, or is it just me who is surprised by this? I don't like the ppm unit; it is just messing things up.
 
You don't have an airstone in the tank right, so you're looking at straight-up equilibration between water and headspace in your "with a lid" set up? That is interesting that turning the lights on leads to a consumption of the CO2... looks like plants are doing their thing. :) Having a lid on your aquarium essentially turns the headspace into a horizonal CO2 reactor. When you turn the lights off at the end of the day, do you see CO2 levels start to rise again?

Measuring stuff in ppm makes for difficult calculations, but easy-to-understand explanations, which is why I think ppm is so commonly used. Different ways of expressing the various units is one reason why it's so complicated to make sure you get the right version of Henry's Law constant for working out equilibrium between air and water.
 
You don't have an airstone in the tank right, so you're looking at straight-up equilibration between water and headspace in your "with a lid" set up?
That's right. I guess the airstone in an aquarium with a lid would remove the "lid effect", making the aquarium essentially lid-less, letting the water equilibrate with air directly. I have never thought of that previously...

That is interesting that turning the lights on leads to a consumption of the CO2... looks like plants are doing their thing. :) Having a lid on your aquarium essentially turns the headspace into a horizonal CO2 reactor. When you turn the lights off at the end of the day, do you see CO2 levels start to rise again?

I was surprised that the decline followed more or less the same first-order equation similarly to the CO2 diffusion. I expected a CO2 uptake that is steady depending on the light intensity, thus giving a linear CO2 decline. But it makes sense; more CO2 would mean more photosynthesis with the same lighting. You can see in the last plot that in the morning when the lights turn on the next time (I have two light periods within the day), the starting CO2 is a bit higher than when they turned off. And then it declines again. At lower CO2 levels, this is not as spectacular as at higher levels (and also, it is more difficult to measure it), and the accumulation during the night is a slow process, the amount of the CO2 produced and remained in the system is not comparable to that of provided by the tap water.

I did not follow that horizontal CO2 reactor thread, but it looks interesting. The difference here is that the CO2 is produced in the aquarium, and the headspace prevents it from escaping while still providing O2. I need to be careful, though, if I start restricting the airflow in and out of the headspace, not to go too low with the oxygen. But that is what the headspace should take care of, I will show some calculations after I go through and check them. But the idea is not new. That is how our lungs work, keeping the CO2 high in our body (>100x partial pressure compared to air) while still providing enough O2 for respiration.
 
That's right. I guess the airstone in an aquarium with a lid would remove the "lid effect", making the aquarium essentially lid-less, letting the water equilibrate with air directly. I have never thought of that previously...
I'm not so sure how true that is. For example, in my CO2-injected setup (biOrb - video below) there is a tight fitting lid, with a few air holes at the top and continual fresh air supply from an airstone. CO2 gas is considerably more dense than air so as long as the popping bubbles don't cause too much mixing in the CO2-enriched headspace, I would expect a layer of mostly-pure CO2 layered directly on top of the water surface. I haven't been brave enough to do the experiment of turning off the airstone and seeing what (if any) effect that had on pH.


I suspect that having the CO2 gas bubbled through a fine-mist diffuser will increase the rate at which dissolved CO2 reaches equilibrium (with the headspace) but won't change what that equilibrium is. I once did an experiment where instead of having the CO2 be injected through the fine-mist CO2 diffuser, I spliced the CO2 supply directly into the air line connecting the air pump to the airstone, and even though those bubbles are much bigger (in the central air lift column) than those from the CO2 diffuser (coming in on the lower right - might need to set the video to high-def to be able to see them since they are so small), it didn't really change how much CO2 wound up dissolved in the water. In some ways this alternative is a nice set-up because you don't have to faff around with having a CO2 diffuser.
 
I think there is a difference between injecting air and air+CO2 (basically a mix of those two). If you inject air only, you continuously replace the headspace gas with the rate corresponding to the air stream. I don't think the CO2 production rate from the living creature can hold up with that, unlike the CO2 injection. Probably the CO2 replacement is not 100% efficient, but still, there must be mixing and diffusion of CO2 out of the system. But I agree that collecting CO2 in the headspace from your injection should make the CO2 delivery more efficient.
It can be tested, though, what is the effect of the air injection, and I plan to do so. The air pump could be set to turn on periodically, and I could watch what the CO2 levels are in the headspace and the water. It's just I am collecting the experiment ideas at a higher rate than I can do them.
 
Interesting read. Cannot contribute anything scientific, more of an observation of my tank. I have a DIY constant monitoring system with ph/TDS/temp/lux etc. I found the co2 formulas based on ph/temperature/kH online and I'd say it's accurate enough for aquarium use. I overlay current and prior day on my graph. Over last couple of years I noticed there are few things that affect how fast my tank "de-gas":

Material difference(I can see difference on the graph with my eyes) caused by:

1) water surface movement (undisputed biggest factor)
2) initial level of saturation with CO2
3) plant mass, how close to a trim I am (longer tail end after trim)
4) what time I open the blinds in the room
5) the weather outside

There's other few interesting things, for example TDS goes up every day as water evaporates/ferts are added, only to go down again at night when my top up kicks in. I imagine that would be way more material if I didn't top up automatically on daily basis.

Also in the long run. I do not think my plants care at all at what time I open the blinds in the room 😀

Best,
Matt
 
Last edited:
Back
Top